Broadcast: News items
Infographic: view staff survey 2024 results highlights at a glance
Posted on behalf of: Internal Communications
Last updated: Thursday, 21 November 2024

Thank you to everyone who took part in our recent staff survey – 2,044 colleagues shared their views on working life at Sussex and your feedback will help us to improve the staff experience. Vice-Chancellor Sasha Roseneil shared the highlights with staff in an email message, and you can view survey results in brief on the infographic below:

View a transcript of the infographic below:
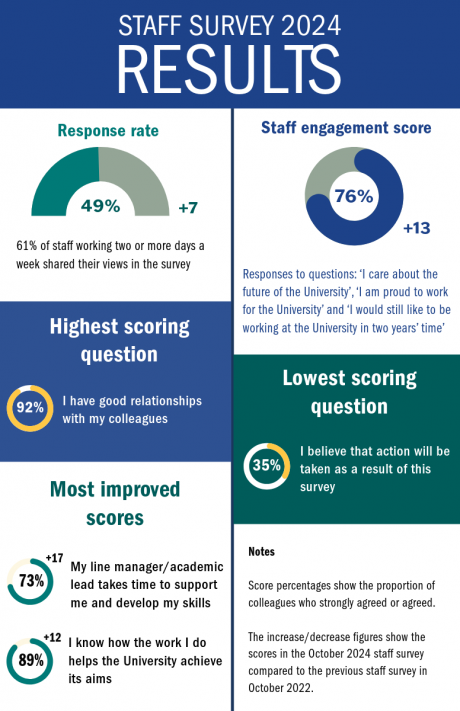
Response rate
The response rate was 49%, a 7% increase compared to the last survey in October 2022.
61% of staff working two or more days a week shared their views in the survey
Engagement score
76% staff engagement score, which is a 13% increase compared to the last survey. This score includes responses to the following questions: ‘I care about the future of the University’, ‘I am proud to work for the University’ and ‘I would still like to be working at the University in two years’ time’.
Highest and lowest scoring questions
The highest scoring question was: ‘I have good relationships with my colleagues’, with 92% of respondents strongly agreeing or agreeing.
The lowest scoring question was: ‘I believe that action will be taken as a result of this survey’, with 35% of respondents strongly agreeing or agreeing.
The most improved scores include:
73 % of respondents believe ‘My line manager/academic lead takes time to support me and develop my skills’, representing a 17% increase compared to the last survey.
89% said ‘I know how the work I do helps the University achieve its aims’, which is a 12% increase.
Notes:
Score percentages show the proportion of colleagues who strongly agreed or agreed.
The increase/decrease figures show the scores in the October 2024 staff survey compared to the previous staff survey in October 2022.

